🔍See Your Financial Data in Action
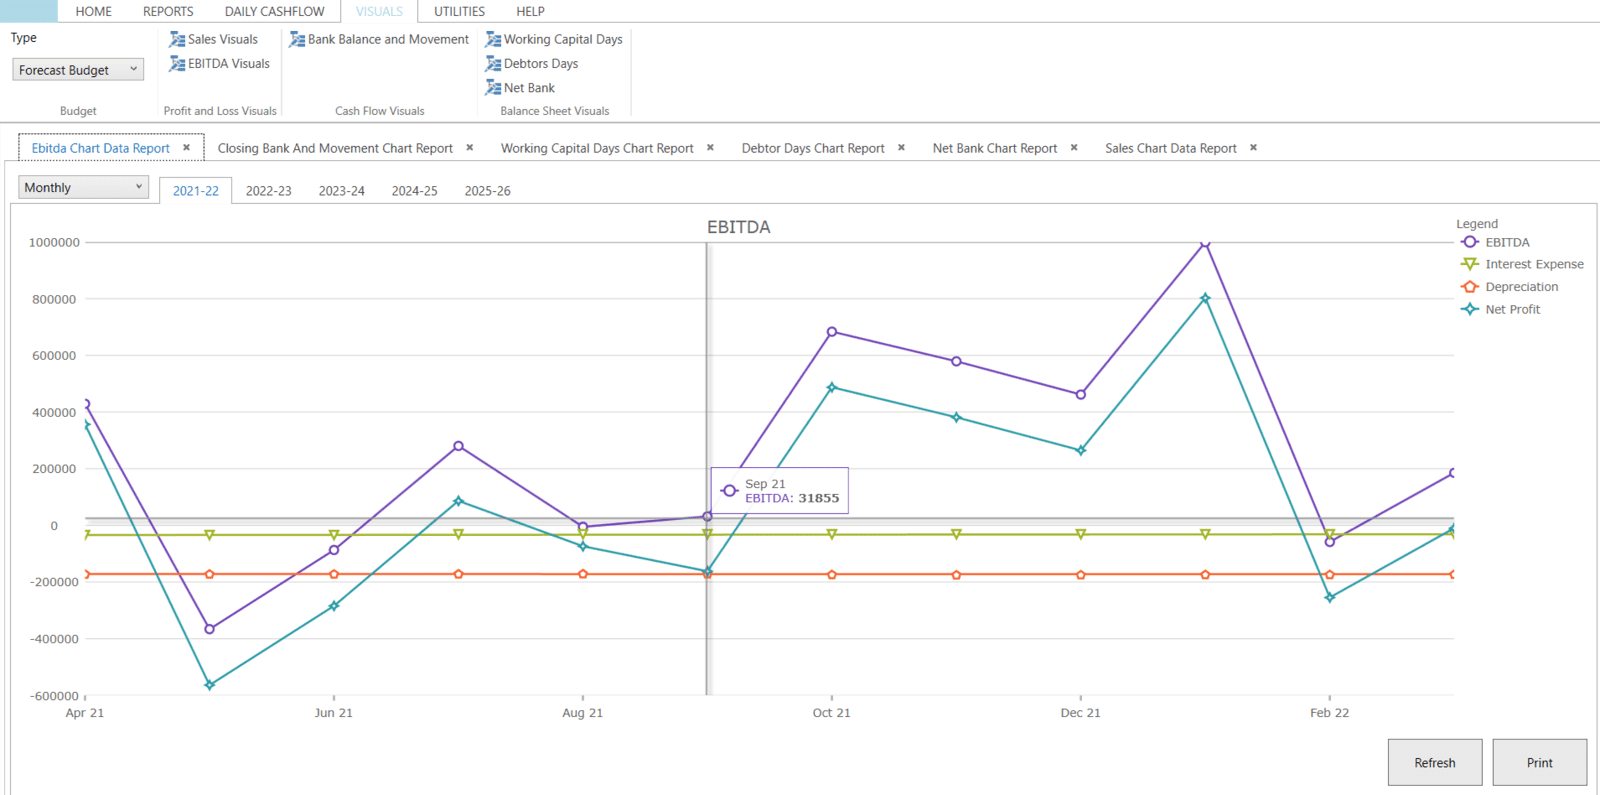
Similar to dashboards, Forecast 5's Visuals feature brings your financial data to life with dynamic, interactive graphs. Designed to complement our standard reports, these visuals provide a clear, at-a-glance view of key metrics, helping you monitor performance and trends effortlessly.
Available Visuals
🔹EBITDA: Track earnings before interest, taxes, depreciation, and amortization over time.
🔹Sales Visual: Visualize sales performance to identify growth patterns.
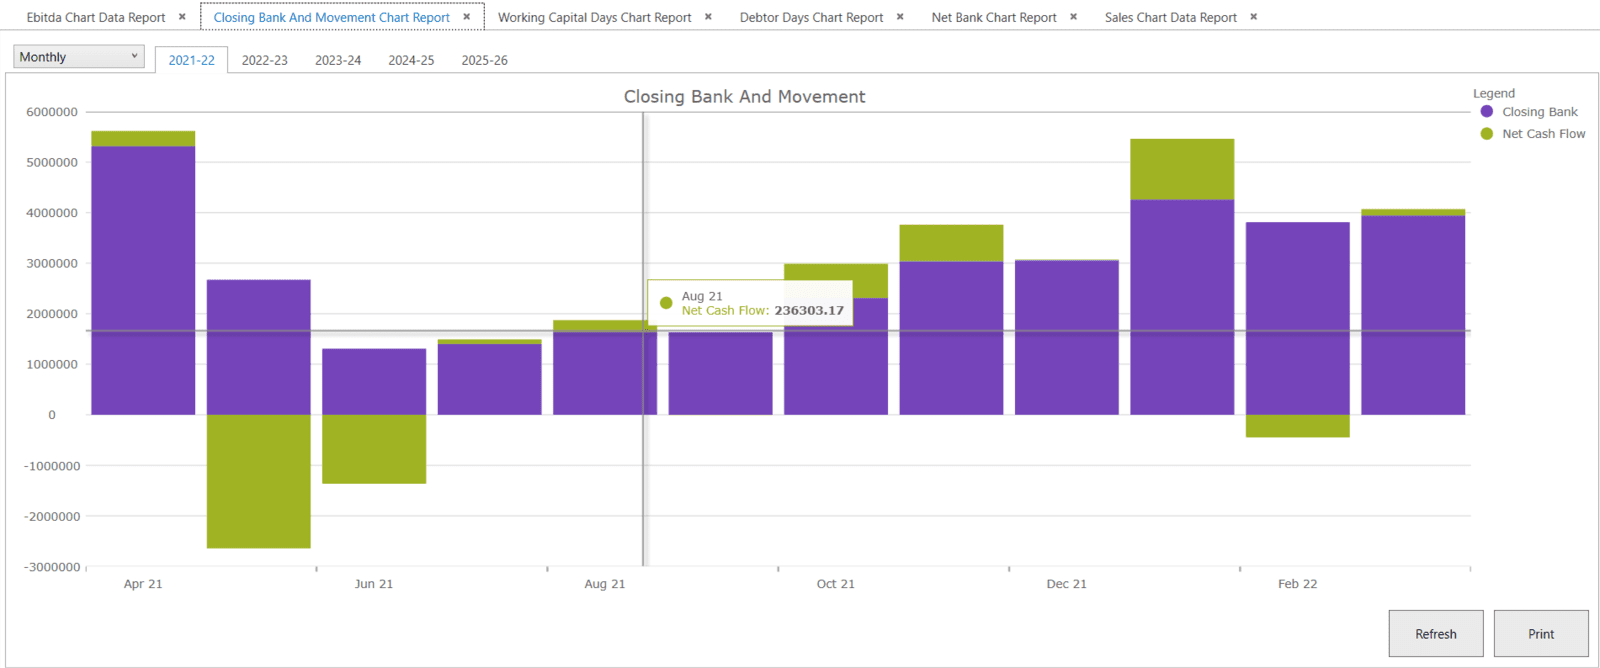
🔹Bank Balance and Movement: Monitor cash flow and bank balances with ease.
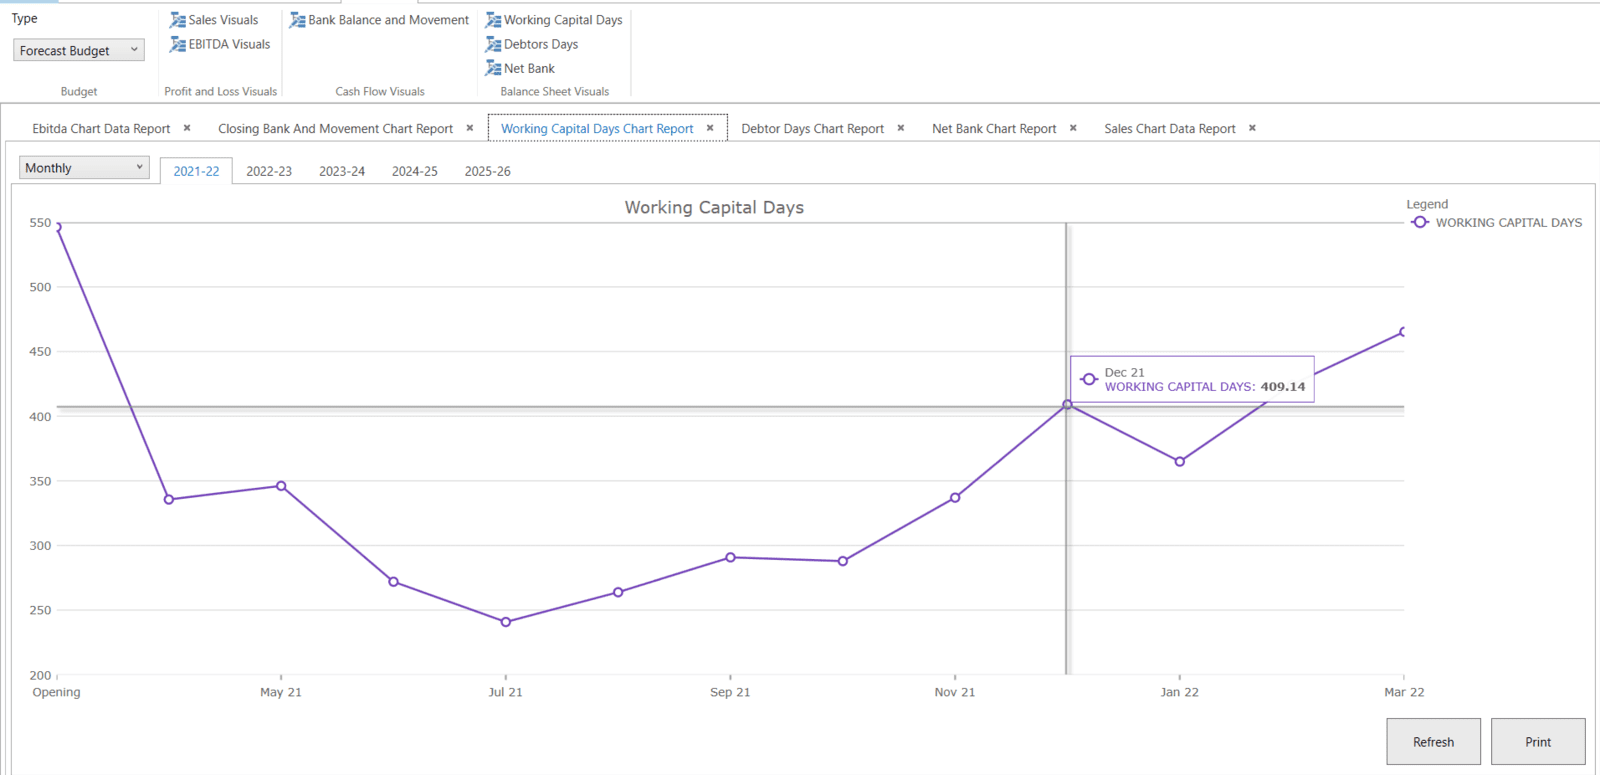
🔹Working Capital Days: Assess the efficiency of your working capital management.
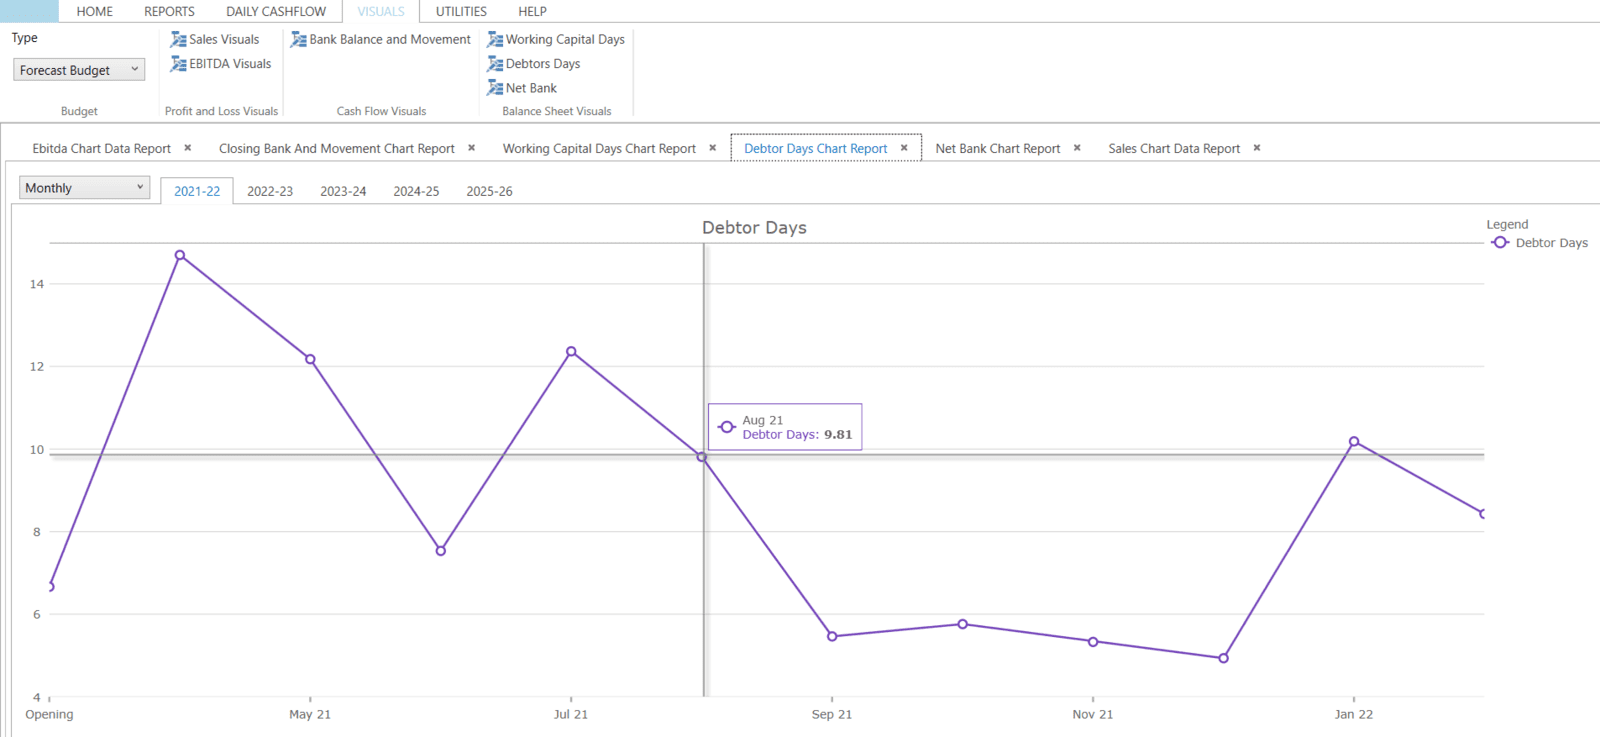
🔹Debtors Days: Evaluate the average collection period for receivables.
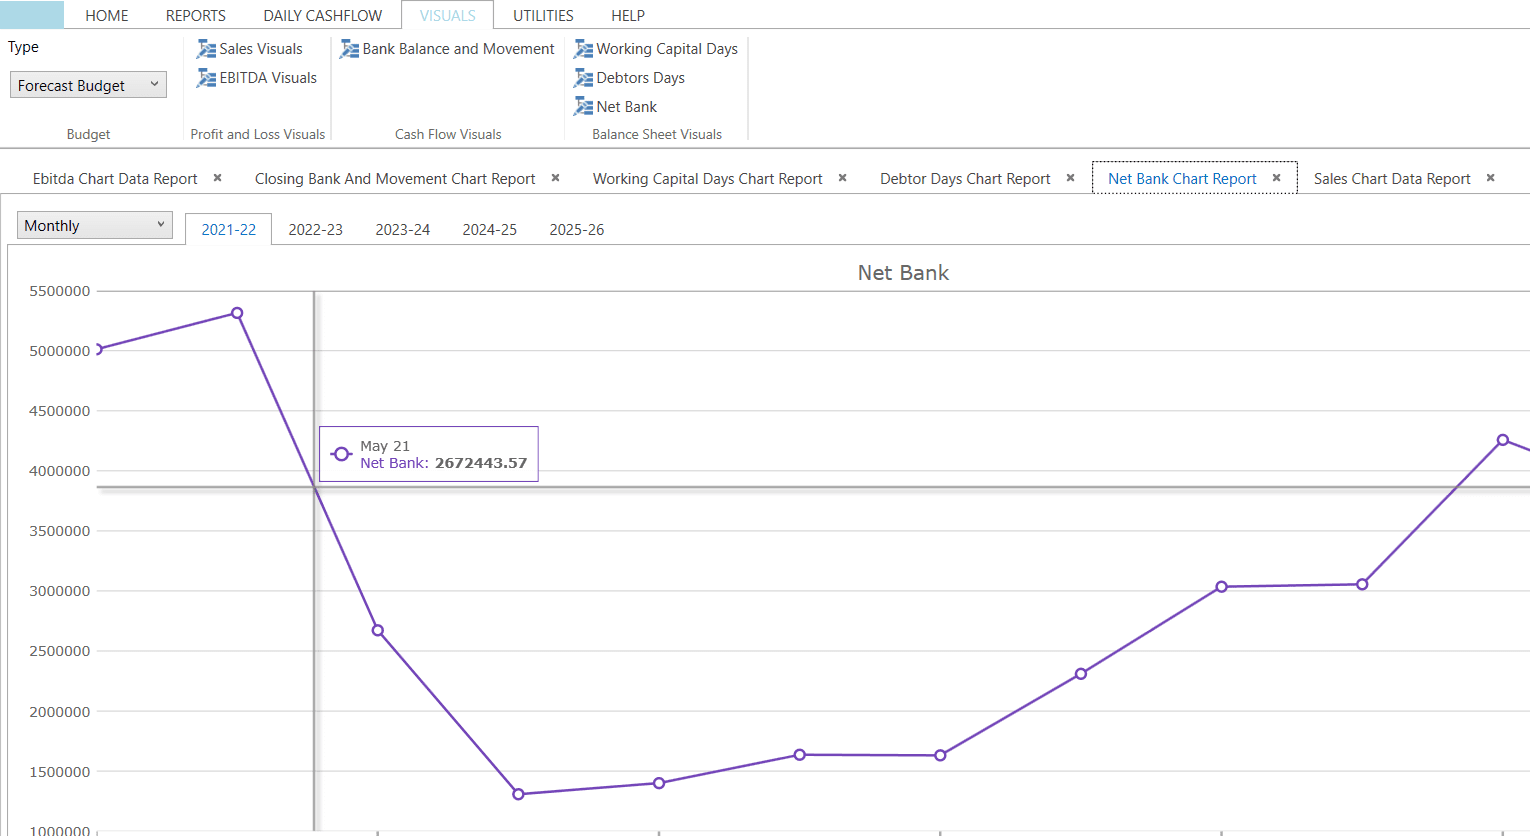
🔹Net Bank: Understand your net cash position after liabilities.
These visuals are available in monthly, quarterly, or annual views, allowing you to analyse data at your preferred interval. Whether you're preparing reports or analysing trends, Forecast 5's Visuals provide a comprehensive and intuitive way to interact with your financial data.