🛠️A Unique Toolset to Build Custom Reports
Forecast 5's Report Views gives you direct access to raw forecast data from your database, allowing you to create custom dashboards, reports, and visualisations that are tailored specifically to your organization’s needs. Rather than being limited to standard reports, you can design outputs that highlight the metrics and trends that matter most to your business.
This flexibility empowers finance teams and decision-makers to extract actionable insights quickly, identify trends, and make informed strategic choices with confidence. Whether you’re tracking revenue performance, monitoring cashflow, or comparing multiple forecast scenarios, Report Views provides a powerful foundation for data-driven decision-making.
Forecast 5 seamlessly integrates with popular tools like Power BI, Excel, Alchemex, and Velixo, enabling you to leverage the software you already use while enhancing your reporting capabilities. You can build custom dashboards, combine multiple data sources, and visualize your financial data in ways that are most meaningful for your team.
By using Report Views, your organization can:
🔹Generate custom reports tailored to specific departments, stakeholders, or projects.
🔹Analyse detailed financial data beyond standard reporting templates.
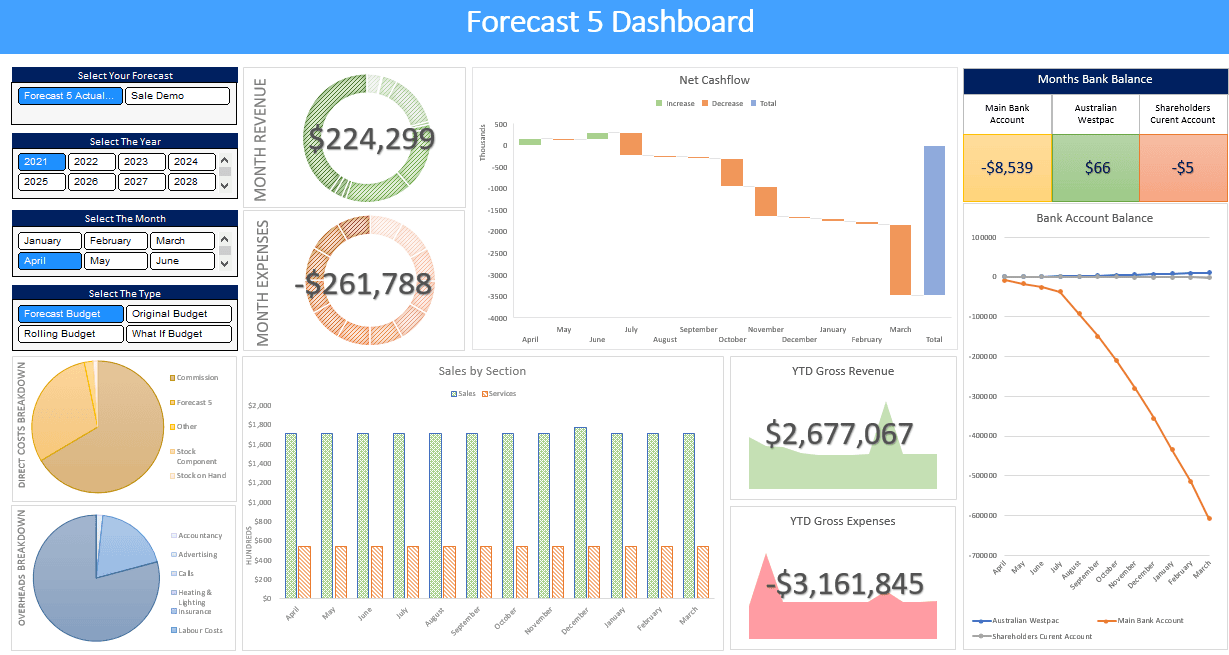
🔹Create interactive dashboards that make it easier to track key metrics and trends.
🔹Reduce manual data handling and streamline reporting processes for greater efficiency.
With Forecast 5 Report Views, you gain complete control over your financial data, making it simpler to turn raw numbers into insights that drive smarter, faster, and more strategic decisions.